

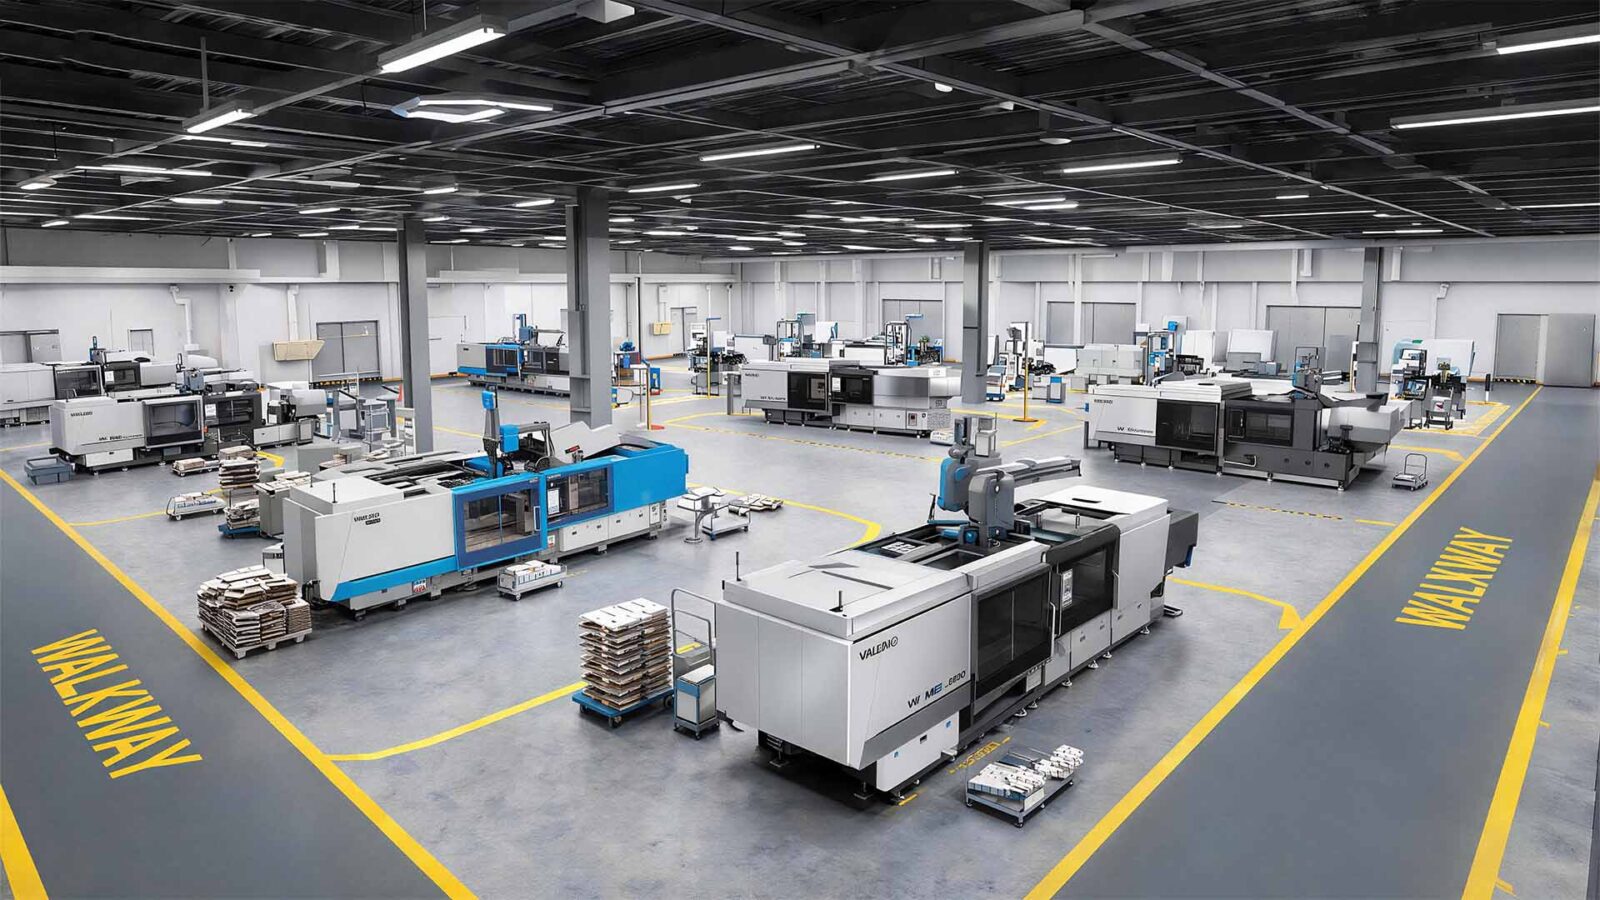
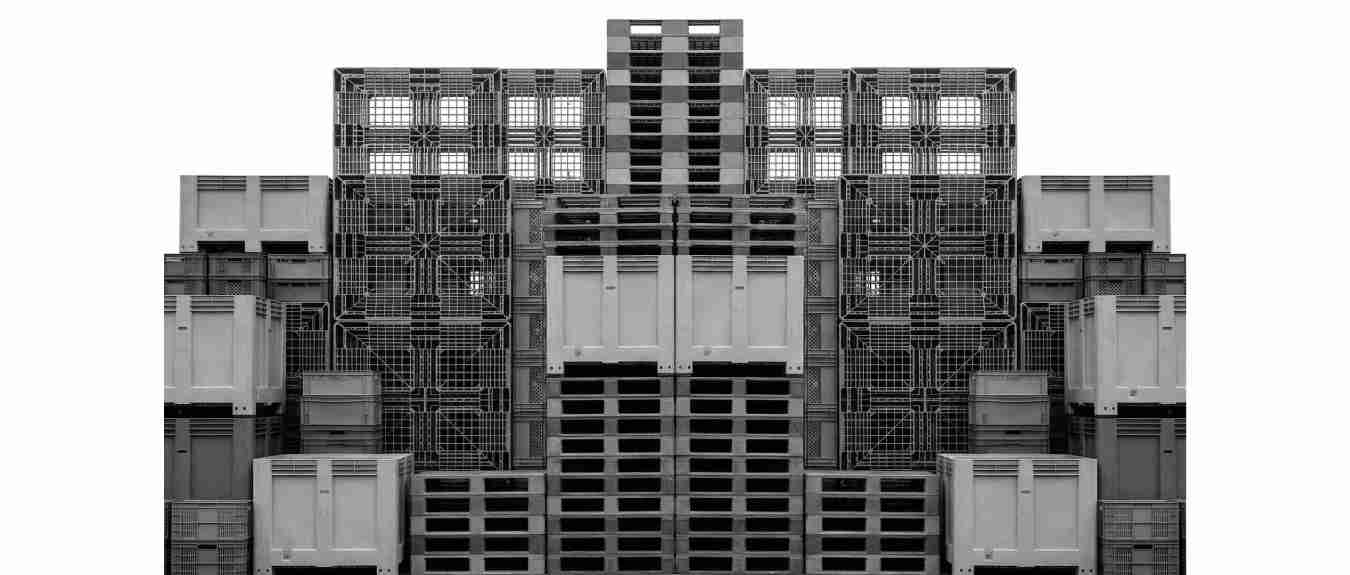
Cost breakdown of raw materials, electricity, and labor expenses in the production of one plastic pallet and one plastic crate!
In the production of plastic pallets and crates (using the injection molding method), the cost structure relies heavily on raw materials. A high level of automation and the use of robotic systems keep labor costs to a minimum, while energy consumption represents a significant expense depending on the mold size and tonnage.
The average cost breakdown per unit is as follows:
Cost Breakdown for Plastic Pallet and Crate Production
| Cost Item |
Proportional Distribution (%) |
Description and Contributing Factors |
| 1. Raw Materials (PP / HDPE / Recycled) |
70% – 80% |
This constitutes the largest portion of production costs. The product’s weight (e.g., 15–25 kg heavy-duty pallet vs. 1.5–3 kg crate) directly determines the raw material cost. Using rHDPE/rPP (recycled) instead of virgin polymer can reduce this cost by 20–30%. |
| 2. Electricity and Energy (Energy Expenses) |
10–15% |
In particular, the motors of large 2,400-metric-ton injection molding machines, barrel heaters, and the facility’s massive chiller systems consume significant amounts of electricity. Cycle time and servo motor technology directly impact energy efficiency. |
| 3. Direct Labor |
3% – 7% |
Since production is based on full automation (robotic part-picking systems, automatic feeding), the labor cost is low. A few operators, quality control personnel, and a forklift operator per shift are sufficient for the entire factory. |
| 4. Mold Depreciation and General Expenses |
5%–10% |
This includes the lifespan of high-cost steel molds (capacity for millions of impressions), factory rent, maintenance and repair expenses, and insurance costs. |
Cost Dynamics Between Pallets and Crates
- For Plastic Pallets: Since the product weight is high (typically ranging from 12 kg to 25 kg), raw material costs can account for up to 82–85% of the total cost. Although the energy consumption of a 2,400-metric-ton machine is high, the high production volume offsets the energy cost per unit.
- For Plastic Containers: Since the products are lighter (1 kg–4 kg), the raw material share is slightly more flexible. However, the cycle times for crates are shorter than those for pallets (they are produced faster), which increases hourly output and reduces overall labor and energy costs per unit.
Average return on investment (ROI) and break-even analysis for a production line producing 2,400 metric tons of pallets and 500 metric tons of crates.
Plastic pallet and crate manufacturing requires high initial capital (CAPEX) (Capital Expenditures), but with the right market positioning and high Overall Equipment Effectiveness (OEE), it is a capital-intensive sector that offers a highly satisfactory return on investment (ROI) (Return on Investment).
Here are the key financial dynamics, break-even analysis, and return on investment (ROI) calculations for this facility investment:
1. Return on Investment (ROI)
The average return on investment (ROI) for a plastic injection molding facility varies depending on raw material procurement costs, unit energy prices, shift schedules (2 or 3 shifts), and the ratio of raw material usage (virgin vs. recycled).
- Average ROI Period: For a fully integrated, high-capacity production line, the average payback period ranges from 2.5 to 4 years.
- Key Factors Affecting Profitability:
- Raw Material Cost: Since raw materials account for 75–80% of costs, the use of rHDPE/rPP (recycled raw materials) directly increases margins and shortens the ROI period.
- Capacity Utilization Rate (OEE): Operating the facility 6–7 days a week on a 3-shift basis (with an OEE of 80%+) reduces fixed costs per unit.
- Mold Investment and Variety: A variety of molds in different weights and models provides the flexibility to sell to different sectors (food, logistics, agriculture).
2. Break-Even Point Analysis
The break-even point is the minimum production and sales volume at which the factory covers all its fixed costs (rent, personnel, depreciation, financing) and variable costs (raw materials, electricity) without incurring a loss.
Cost Structure
- Fixed Costs: Factory rent, administrative and technical staff salaries, insurance, machinery depreciation, maintenance and repairs, and general expenses. (The total monthly fixed costs form a specific baseline.)
- Variable Costs: Raw materials (polymer + additives) per pallet or crate produced, electricity consumption, packaging, and logistics costs.
Break-Even Point Based on Production Volume
- Plastic Pallets (2400T Line): Since the unit weights of the pallets are high (e.g., 15–20 kg), the raw material cost is high. However, the market unit selling price for heavy-duty pallets is also high. The break-even point is reached when sales account for 40–50% of monthly installed capacity; every pallet produced beyond this point begins to generate net profit.
- Plastic Crates (500T Line): Although the crates are lighter (1.5–3 kg), they are produced in very high volumes due to rapid production cycles. Thanks to high volume turnover, crates are the strongest factor in balancing the facility’s overall cash flow and the amortization of fixed costs.
3. Financial Optimization and Risk Management Tips
- Recycled (rPP/rHDPE) Content: Especially in industrial pallets, blending high-quality recycled raw materials or regranules at specific ratios instead of using 100% virgin raw material can significantly reduce costs and increase profit margins by 15–20%.
- Energy Cost Management: Given the high energy consumption of the 2,400-metric-ton machine, operations can be concentrated during off-peak hours when electricity rates are lower, or the facility can be supported by solar energy (SE) investments for on-site consumption.
- Mold Variety: Starting with the standard 120×100 cm pallet molds and common agricultural/food crate molds—which are in highest demand in the initial phase—ensures cash flow during the first years of the investment.